-CHGWDife.webp)
AI & Automation
The future of software isn't humans vs. AI — it's humans with AI
Read more
Development
Turn scattered operational data into a clear view of what your team should do next.
· 5 min read

Most operations already hold more data than anybody reads. Orders, tickets, shifts, invoices and delivery times sit across four or five systems that were never meant to be compared.
The gap is not collection. It is the step between seeing a figure move and knowing which action that movement calls for, and who is expected to take it.
A number with no agreed response attached to it is reporting, not decision support.
Revenue, churn and monthly margin lag. By the time they move, their causes are weeks behind. They settle arguments well and steer badly, because nothing done today shows up in them today.
Leading indicators move first: quote response time, backlog age, the share of jobs rescheduled. Choosing them is a short exercise, run once for each outcome the team is judged on.
Keep the two kinds visually separate. Mixed into one row of tiles, a figure nobody can influence directly gets treated as a target, which produces effort in the wrong place.
A figure read only when somebody remembers to look will be missed in the week it matters. Decide in advance the level at which it stops counting as normal.
Set thresholds from the recent distribution rather than a round number: a limit chosen for looking tidy either fires constantly or never fires. Two levels suffice, one colouring the tile and one messaging a named person.
Alerts need a budget. Every alert that fires without requiring action trains its recipient to ignore the next, so one dismissed several weeks running should be retuned or switched off.
An average across the whole business hides the thing worth acting on. A stable mean delivery time can contain one region getting steadily worse and another that improved enough to mask it.
Cut by dimensions that map to a lever: region, team, product line, channel, shift. Where nobody can act differently on a segment, the split gives an interesting chart rather than a decision.
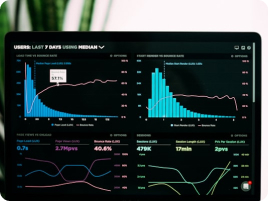
Distribution matters as much as the cut. The median and the upper percentiles describe the experience of the worst-served customers far better than the mean, and those customers leave first.
Numbers get acted upon when a recurring meeting exists whose agenda is the numbers. Each rhythm should match the speed at which its figures can move, and each slot needs an owner.
The step most often skipped is recording what was decided and returning to check whether it worked. A short note holding the reading, the action and the effect expected makes a run of meetings something to learn from.
It also exposes measures that lead nowhere. A figure reviewed for months that has never changed what anybody did belongs in an archive rather than the weekly pack.
AI & Automation
Read more
Development
Read more
AI & Automation
Read more